
How Presidential Elections Affect Consumer Spending
Does uncertainty and fear lead to slower business, as we all think?

Dear Readers,
Over the last few months, I’ve had numerous lengthy conversations with people across my industry, at the retailer, wholesaler, and manufacturer levels. Most people are in the same boat: business is slow, consumers are being really careful about their spending, they’re fearful – you’ve likely heard this before. Inflation has hit the economy hard, but the number one topic that everyone brings up is the uncertainty that the quadrennial election cycle has on consumer spending.
Anecdotally, we seem to see this every four years in business, no matter who is running. Markets and consumers hate uncertainty, especially when it has to do with which economic policy will prevail over this country. We’ve always been aware of it and discussed it with other business colleagues, who seem to see the same effect.

So, when I sat down to quantify this, I was really excited to find some data showing how consumer spending slows in the months preceding a United States presidential election. Except, I couldn’t find anything definitive. I tried changing the type of data I was looking for. I even tried some confirmation bias and looked specifically for a study that would support my thesis. After hours poring through the data, I had to face the apparent fact: I seemed to be wrong.1
There is some interesting data on both sides of the argument, and I wanted to better understand what I was looking at.
Tons of articles, both from mainstream media and research firms, state the obvious: elections create uncertainty, and consumers do not like uncertainty. Most convincingly, though, the Federal Reserve Bank of Richmond has two charts showing just how much economic uncertainty changes through each quarter of a four-year cycle.
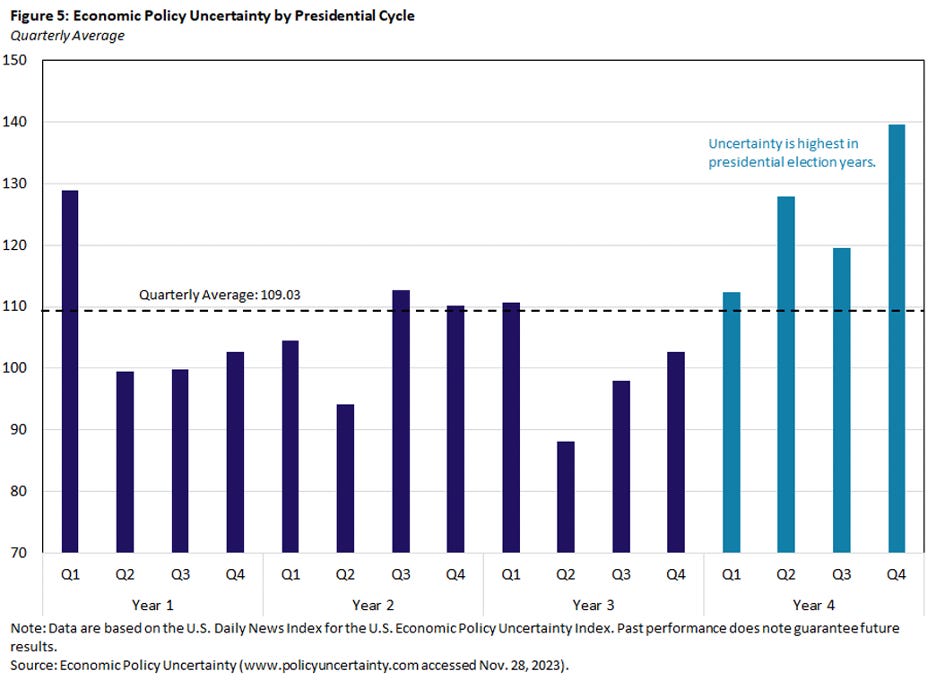

You can see that presidential elections cause uncertainty, but uncertainty doesn’t necessarily equate to a change in spending. Sure, one study found three times as many consumers planned to spend less as did consumers who planned to spend more. Another study found that international firms tend to reduce their investment expenditures during an election cycle.
But most of the spending changes occur much closer to the actual election, and not months out. During the 2015-16 election season, Epsilon found that retail sales dropped nine percent in the two weeks prior to the election, regardless of consumers’ party affiliation. ShopperTrak found that during the 2004 election cycle, while retailers had a 0.7 percent year-over-year decline in sales, the biggest drop was 2.2 percent the week before Election Day. Adobe Analytics reported that in 2016, online sales fell 14 percent the day after the presidential election, and spending fell six percent during the couple weeks before the election.
But that’s mostly it. In scouring the depths of the Internet, across millions of media reports and thousands of studies, this is some of the only data that shows any change in consumer spending ahead of an election.
On the other hand, there is a plethora of data showing the economy holds up just fine in the same timeframe. US GDP (gross domestic product) as a whole tends to trend higher during election years, while the national unemployment rate seems to be unaffected. A study by Criteo showed that for retailers whose average order value is under $1,000, sales were no different in the run up to the 2016 election – and in fact saw a huge spike in sales after the election results were known.

Let’s turn to the stock market to see how it responds to the same environment. While there is data showing that markets see more volatility ahead of an election than any other time during the four-year-cycle, it doesn’t seem to affect the performance of stocks as a whole. The average S&P 500 annual return in an election year is almost identical to that of a non-election year.2
At the end of the day, the hard data does not match the anecdotal data, which is certainly frustrating as a business owner. You assume that your observations are correct – and maybe they are, but there simply hasn’t been a study that confirms it. More realistically, our preconceived notions are likely incorrect, and we need to adjust accordingly. It’s one of the hardest things to do in business, but it’s the only way to grow as a leader and as a company.
In closing, I want to share a related anecdote that recently made me laugh. I was chatting with an industry veteran who my family has known forever – they are quite smart and I always respect their opinion. This person made a comment to me that they hope Donald Trump wins in November because then the markets will go up. I immediately thought back to a Charles Schwab research report that came out earlier this year that showed if you invested in the stock market only when a Republican was in the White House, a $10,000 initial investment in 1961 would be worth $102,000 by 2023. If you invested in the stock market only when a Democrat was in the White House, a $10,000 initial investment in 1961 would be worth over $500,000.
Before any of you on the left begin popping champagne, here’s the kicker: if you remained invested from 1961 onward, with no change in strategy based on who was in the White House, your portfolio would be worth $5.1 million today. Being politically partisan in your business decisions and over-worrying about the election can cost you up to $5 million over the course of your life.
The lesson from all these data points is this: stop worrying about elections when it comes to your business. It’s all noise, and at the end of the day it has little to no effect, other than providing an unnecessary distraction to you and your staff. Keep your eyes forward, ensure your company is a place where customers don’t have to worry about polls and policy, and let the political pundits keep yelling into the void.
Which, historically, seems unlikely, but here we are.
7.5% vs. 8.0%, which was not statistically significant